ROAS Diagnostic Framework
A systematic waterfall for isolating the root cause when ad performance declines. Works for Meta, Google, TikTok, and any programmatic channel.
Executive Summary
Use this guide when ROAS is down and the team needs the first root cause, not a list of possible excuses. Check measurement first, then walk the waterfall in order: CPM, CTR, AOV or ARPU, and conversion rate. Stop at the first validated leak, fix it, and rerun the read before changing every lever at once.
Reviewed May 20, 2026 against local ROAS methodology plus current Apple ATT, Apple Small Business Program, Google Play service-fee, and Android Privacy Sandbox attribution references. Use company MMP, store, server-side revenue, platform fee, and cohort data before making budget decisions.
The Math Behind the Logic
To diagnose ROASReturn on Ad SpendTotal Revenue generated divided by Total Ad Spend. The ultimate efficiency metric for paid advertising., you need to understand its component parts. ROAS isn't a single metric—it's the output of a formula with multiple inputs.
If ROAS is down, either your costs went up (CPMCost Per MilleThe cost to show your ad 1,000 times. Measures the "price of attention" in the ad auction.) or your revenue per user went down (driven by lower CTRClick-Through RateClicks divided by Impressions. Measures how effectively your creative "stops the scroll.", CRConversion RateConversions divided by Clicks. Measures the effectiveness of your landing page or app store listing., or AOVAverage Order ValueTotal Revenue divided by Number of Transactions. In F2P games, this is often replaced by ARPU (Average Revenue Per User).). The diagnostic waterfall isolates these variables one by one.
Why This Works
By checking metrics in order—CPM → CTR → AOV → CR—you mathematically eliminate possibilities until you find the "leak" in your funnel. Each metric corresponds to a specific fix.
First: Rule Out Attribution Issues (iOS/SKAN)
Before diving into the waterfall, check if your ROAS drop is real or a measurement artifact. Post-iOS 14.5, SKAdNetwork and Privacy Sandbox can cause "phantom" ROAS drops due to signal loss, delayed reporting, or modeled conversions changing. If your in-app revenue is stable but reported ROAS dropped, the problem may be attribution—not performance.
The Diagnostic Waterfall
Work through each checkpoint in order. When you find a "Yes," apply the fix before continuing.
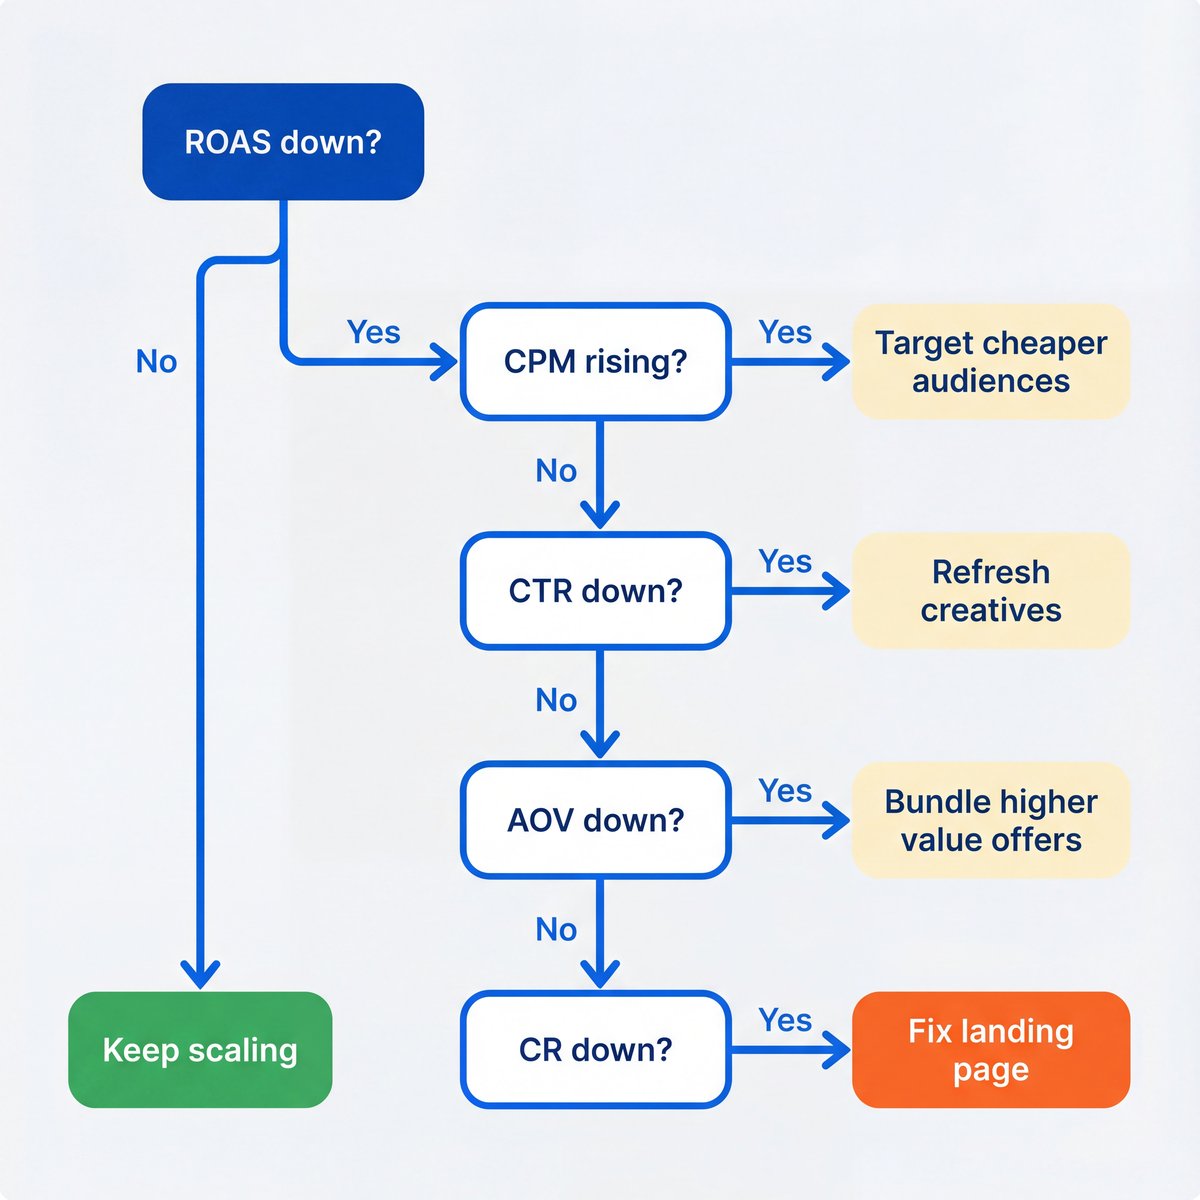
Work through each check in order. When you find a "Yes," apply that fix before continuing down the tree.
Platform-Specific Nuances
The diagnostic waterfall applies universally, but each platform has unique characteristics that affect which lever to pull first.
📘 Meta (Facebook/IG)
Creative is the targeting. The algorithm finds your buyers based on who reacts to the content. "Over-targeting" (narrow interests) often raises CPMs. Broad targeting + great creative usually wins.
🔍 Google Search
Intent-led. Low ROAS here is usually a keyword or negative keyword issue—you're buying the wrong intent. Check your search terms report before blaming creative.
🎵 TikTok
High-velocity creative. CTR decays 3x faster here than on Meta. Entertainment value is a prerequisite for delivery. Plan for 3-4x the creative volume.
F2P Gaming Considerations
Free-to-Play games operate on different cycles. ROAS is rarely "Day 1"—the value accumulates over time.
Key Differences for F2P
- CPI vs LTVLifetime ValueTotal revenue expected from a user over their entire lifespan in the game. In F2P, this often spans 365+ days.: You can afford a high CPI if the D365 LTV is 3x higher. Focus on LTV curves, not just acquisition cost.
- The Whale Curve: ROAS in F2P is often driven by 2% of users. Focus on "Event Optimization" (e.g., optimizing for 'Level 10 reached' or 'First Purchase') rather than just installs.
- Retention as a ROAS Lever: If ROAS is low, it's often a D1/D7 retention problem, not an ad problem. Check product metrics before adjusting UA.
- Cohort Maturity: Don't judge campaigns until cohorts have reached D30-D90. Early ROAS reads are misleading.
The 143% Breakeven Rule
With 30% platform fees (Apple/Google), you need ~143% ROAS to break even on D365. Any ROAS below this threshold means the product needs work before you scale spend.
Advanced: Second-Order Effects
Fixing one metric often affects others. Be aware of these trade-offs:
| Effect | What It Means | Operating Rule |
|---|---|---|
| CTR / CR inverse | Vague ads can raise clicks while lowering qualified conversion. | Use specificity when CR is the leak. |
| Scale / efficiency wall | ROAS usually drops as spend expands into marginal audiences. | Judge whether the new marginal spend is still profitable. |
| CPM / quality correlation | High-value buyers are often more expensive to reach. | Do not chase cheap traffic if buyer quality falls. |
| Channel mix effect | Blended ROAS can move when channel mix changes. | Analyze channels in isolation before blaming product. |
When This Framework Doesn't Apply
Edge Cases to Watch
| Case | Why ROAS Misleads | Use Instead |
|---|---|---|
| Brand awareness | Reach and frequency are the goal. | Brand lift and aided recall. |
| New product launch | The team is buying learning, not immediate profit. | Learning budget and confidence in early signals. |
| High-consideration B2B | Direct-response ROAS misses long sales cycles. | Pipeline value and MQL cost. |
| Organic / paid mix shift | Lower paid spend can inflate blended ROAS. | Paid-only ROAS and channel-specific reads. |
Quick Reference
| Metric | What It Measures | If Down... | Primary Fix |
|---|---|---|---|
| CPM | Cost to reach 1,000 people | Costs too high | Broaden targeting, refresh creative |
| CTR | % who click your ad | Ads not engaging | New creative, stronger hooks |
| AOV/ARPU | Revenue per transaction/user | Users spending less | Bundles, upsells, pricing review |
| CR | % who convert after click | Landing page friction | UX optimization, load speed, copy alignment |
Current Source References
| Reference | Use in This Guide |
|---|---|
| Apple App Tracking Transparency | iOS attribution and permission caveat. |
| Apple Small Business Program | Store fee tier verification for breakeven assumptions. |
| Google Play service fees | Google Play fee tier verification for breakeven assumptions. |
| Android Privacy Sandbox attribution overview | Privacy-preserving attribution caveat. |
skills/skills/ROAS_ANALYSIS_PIPELINE.md | Local ROAS source handling, revenue type, platform fee, and projection methodology. |
Key Takeaway
This chart is an accurate Diagnostic Waterfall. If you follow it from top to bottom, you will mathematically find the metric that is dragging your ROAS down.
The Power of Sequential Diagnosis
Don't try to fix everything at once. Work through the waterfall in order. Fix the first problem you find, measure the impact, then move to the next level if ROAS is still underperforming. This prevents wasted effort and clearly attributes improvements.